Detailed Scene Results
We provide per-scene quantitative metrics for our hyperspectral reconstructions. Our method achieves state-of-the-art performance across multiple evaluation metrics including PSNR, SSIM, SAM, and RMSE.
BaySpec Dataset
Best results are highlighted in bold.
| Method | Pinecone | Caladium | Anacampserous | FPS ↑ | |||||||||
|---|---|---|---|---|---|---|---|---|---|---|---|---|---|
| PSNR ↑ | SSIM ↑ | SAM ↓ | RMSE ↓ | PSNR ↑ | SSIM ↑ | SAM ↓ | RMSE ↓ | PSNR ↑ | SSIM ↑ | SAM ↓ | RMSE ↓ | ||
| NeRF | 22.82 | 0.6113 | 0.04146 | 0.0728 | 23.12 | 0.58348 | 0.0491 | 0.0709 | 24.12 | 0.6220 | 0.0384 | 0.0628 | 0.13 |
| MipNeRF | 21.45 | 0.5708 | 0.0483 | 0.0865 | 23.40 | 0.5933 | 0.0465 | 0.0688 | 23.43 | 0.6160 | 0.0488 | 0.0699 | 0.09 |
| TensoRF | 24.12 | 0.6545 | 0.0393 | 0.0625 | 24.79 | 0.6244 | 0.0616 | 0.0677 | 25.07 | 0.6659 | 0.0394 | 0.0588 | 0.17 |
| Nerfacto | 15.36 | 0.4825 | 0.0775 | 0.0896 | 20.63 | 0.5418 | 0.0754 | 0.0835 | 20.93 | 0.6120 | 0.0708 | 0.0857 | 0.50 |
| MipNeRF360 | 25.93 | 0.7378 | 0.0311 | 0.0510 | 26.19 | 0.7112 | 0.0383 | 0.0616 | 26.32 | 0.7261 | 0.0370 | 0.0524 | 0.01 |
| Hyper-NeRF | 20.07 | 0.5811 | 0.0725 | 0.1521 | 19.50 | 0.7505 | 0.0843 | 0.0893 | 20.39 | 0.7260 | 0.0493 | 0.0732 | 0.47 |
| 3DGS | 22.65 | 0.6309 | 0.0516 | 0.0885 | 27.71 | 0.7311 | 0.0276 | 0.0525 | 27.92 | 0.7596 | 0.0431 | 0.0596 | 78.10 |
| Hyper-GS | 27.00 | 0.7299 | 0.0390 | 0.0474 | 27.70 | 0.8354 | 0.0271 | 0.0414 | 26.92 | 0.7545 | 0.0188 | 0.0469 | 2.31 |
| DD-HGS (Ours) | 25.11 | 0.9347 | 0.0572 | 0.0244 | 27.86 | 0.9362 | 0.0221 | 0.0417 | 28.57 | 0.9490 | 0.0217 | 0.0381 | 2.43 |
Surface Optics Dataset
Best results are highlighted in bold.
| Method | Rosemary | Basil | FPS ↑ | ||||||
|---|---|---|---|---|---|---|---|---|---|
| PSNR ↑ | SSIM ↑ | SAM ↓ | RMSE ↓ | PSNR ↑ | SSIM ↑ | SAM ↓ | RMSE ↓ | ||
| NeRF | 8.42 | 0.7461 | 0.0284 | 0.3560 | 9.91 | 0.5534 | 0.0796 | 0.5256 | 0.13 |
| MipNeRF | 13.64 | 0.5684 | 1.0000 | 0.2083 | 11.01 | 0.5878 | 0.0728 | 0.5334 | 0.09 |
| TensoRF | 12.10 | 0.7335 | 0.0212 | 0.2662 | 15.23 | 0.5811 | 0.0435 | 0.3628 | 0.20 |
| Nerfacto | 18.66 | 0.8366 | 0.0708 | 0.1025 | 16.54 | 0.7915 | 0.0176 | 0.1655 | 0.57 |
| MipNeRF360 | 8.47 | 0.7518 | 0.0876 | 0.3825 | 13.92 | 0.8584 | 0.0497 | 0.2035 | 0.14 |
| Hyper-NeRF | 18.60 | 0.8700 | 0.0077 | 0.1187 | 16.91 | 0.7710 | 0.0170 | 0.1587 | 0.49 |
| 3DGS | 25.56 | 0.9695 | 0.0028 | 0.0534 | 21.79 | 0.9385 | 0.0101 | 0.0897 | 79.00 |
| Hyper-GS | 26.77 | 0.9845 | 0.0021 | 0.0445 | 25.30 | 0.9503 | 0.0051 | 0.0569 | 3.56 |
| DD-HGS (Ours) | 28.54 | 0.9191 | 0.0043 | 0.0040 | 48.13 | 0.9340 | 0.0019 | 0.0018 | 2.95 |
Qualitative Results
We present qualitative comparisons of our method against baseline approaches on the BaySpec and Surface Optics datasets.
Spectral Curve Visualization
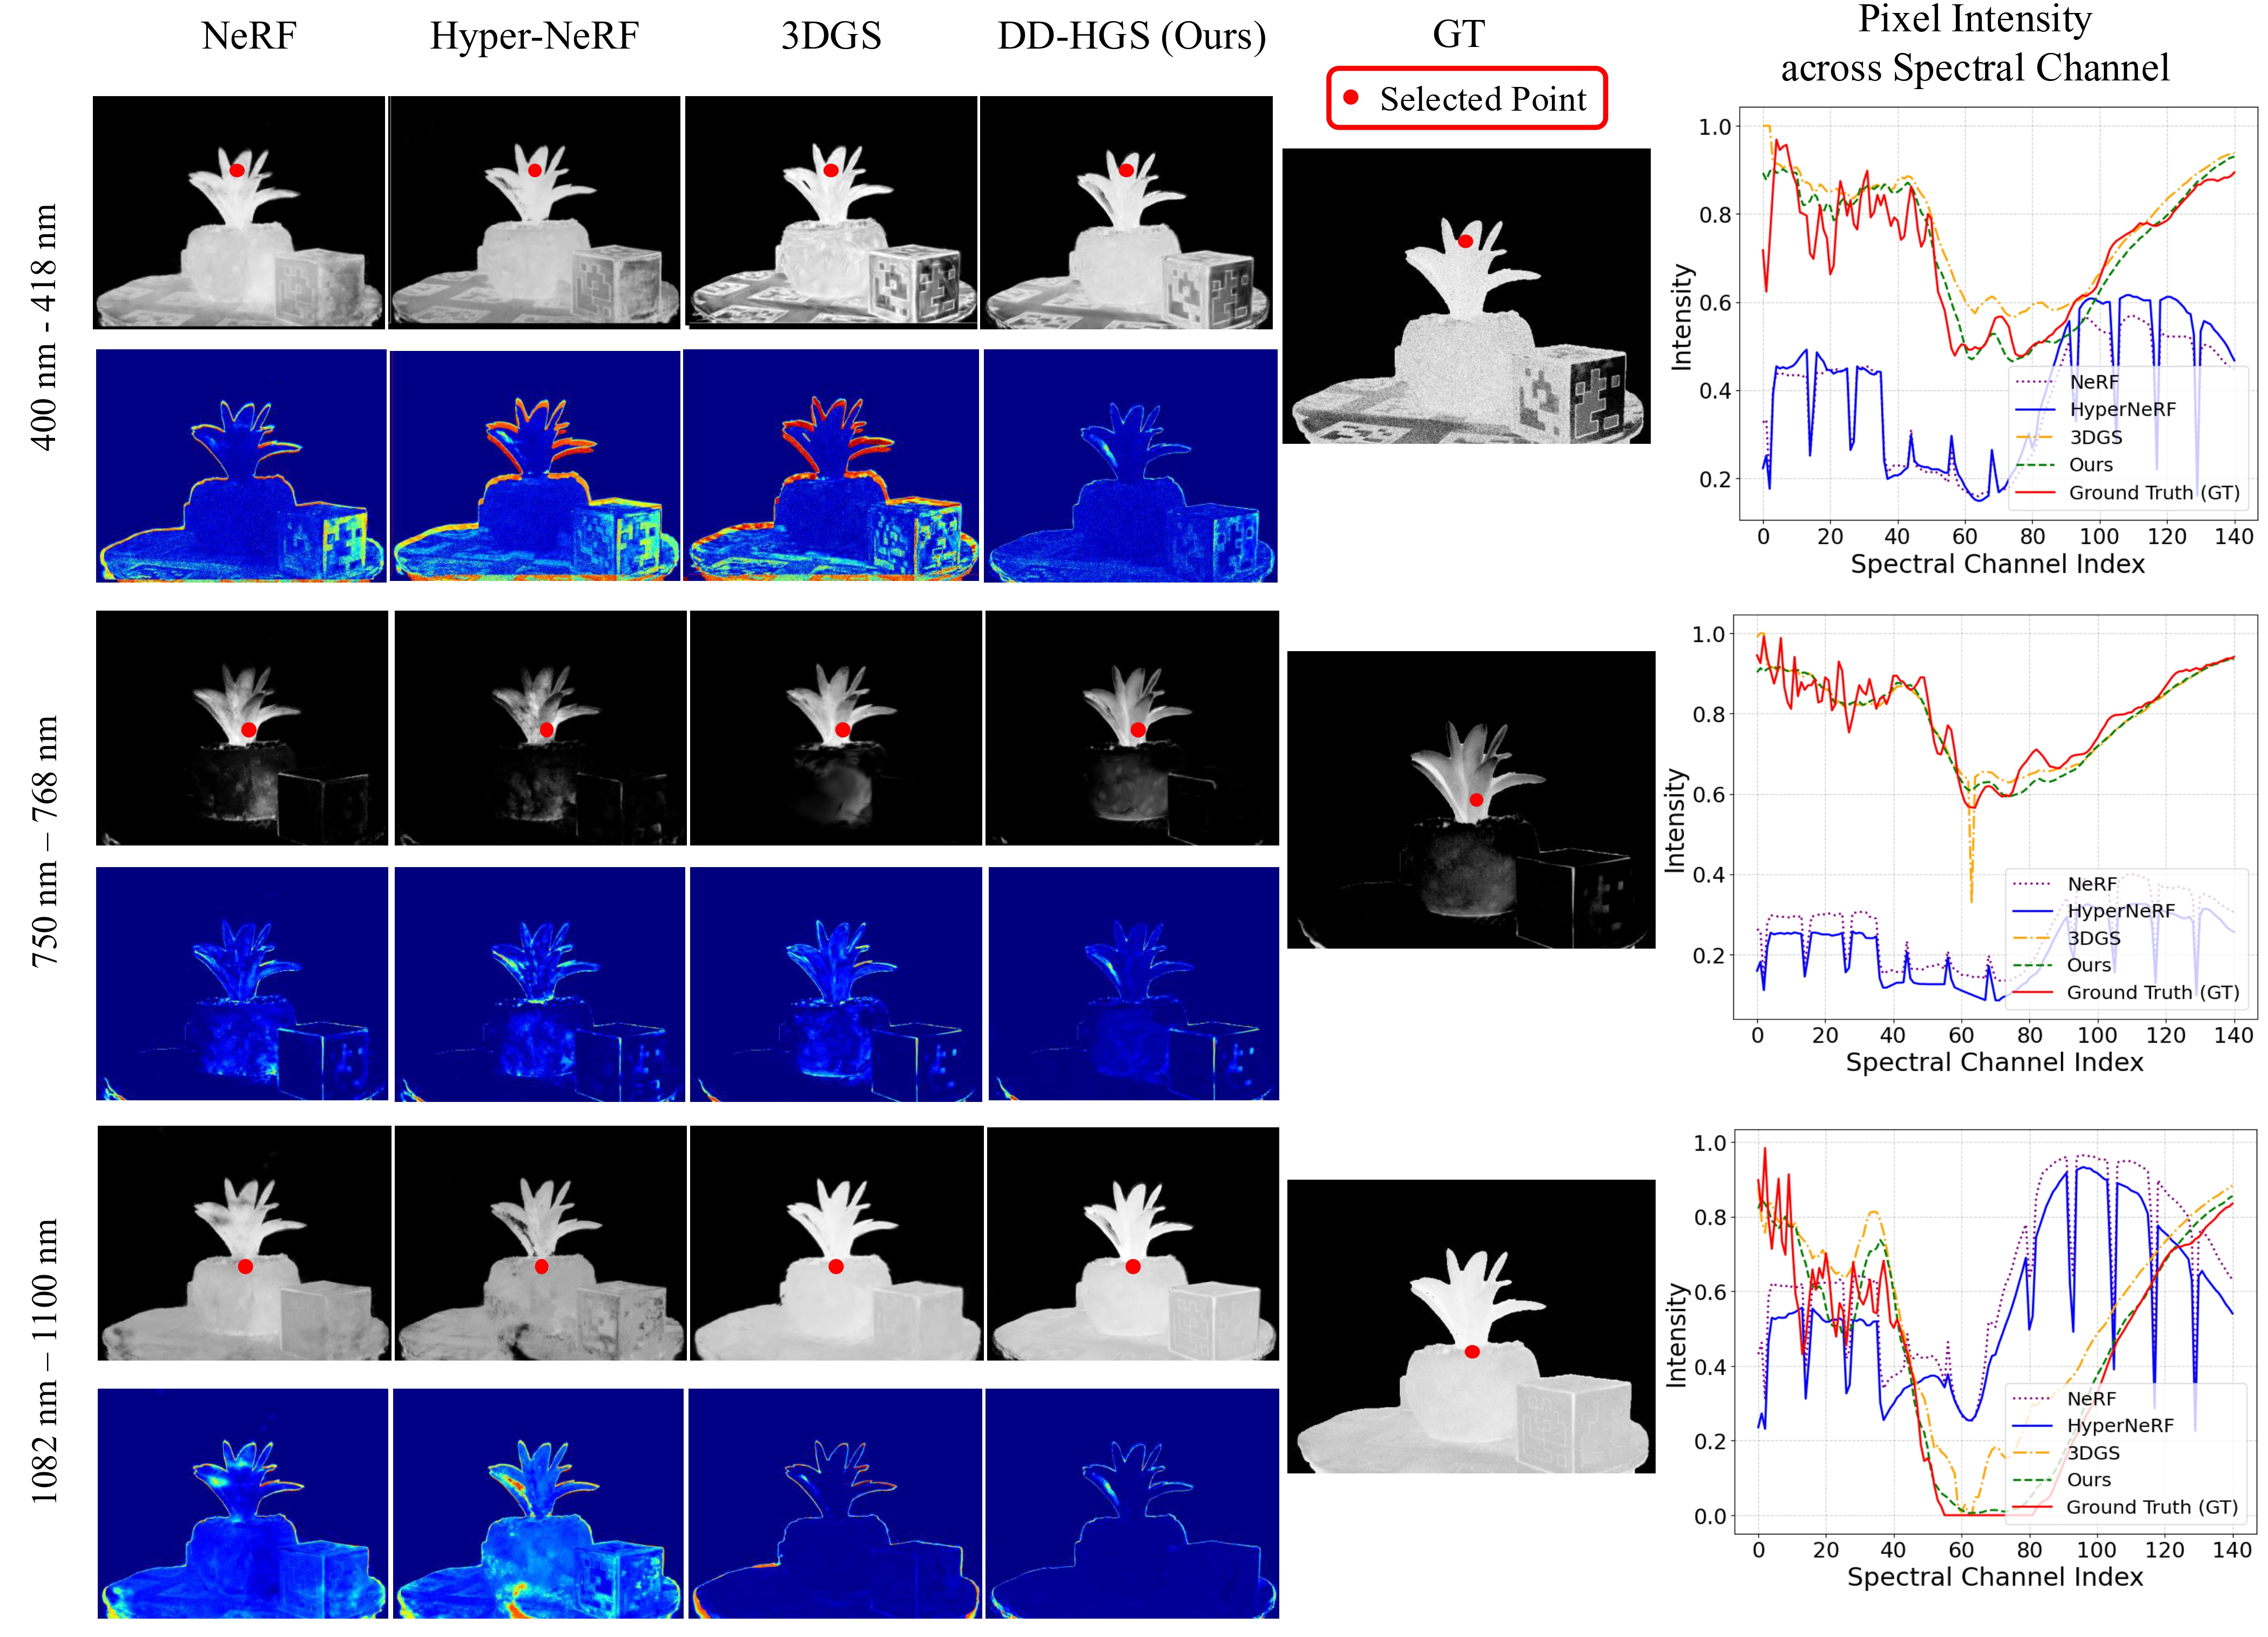
Spectral curve visualization comparing our DD-HGS method with baseline approaches.
BaySpec
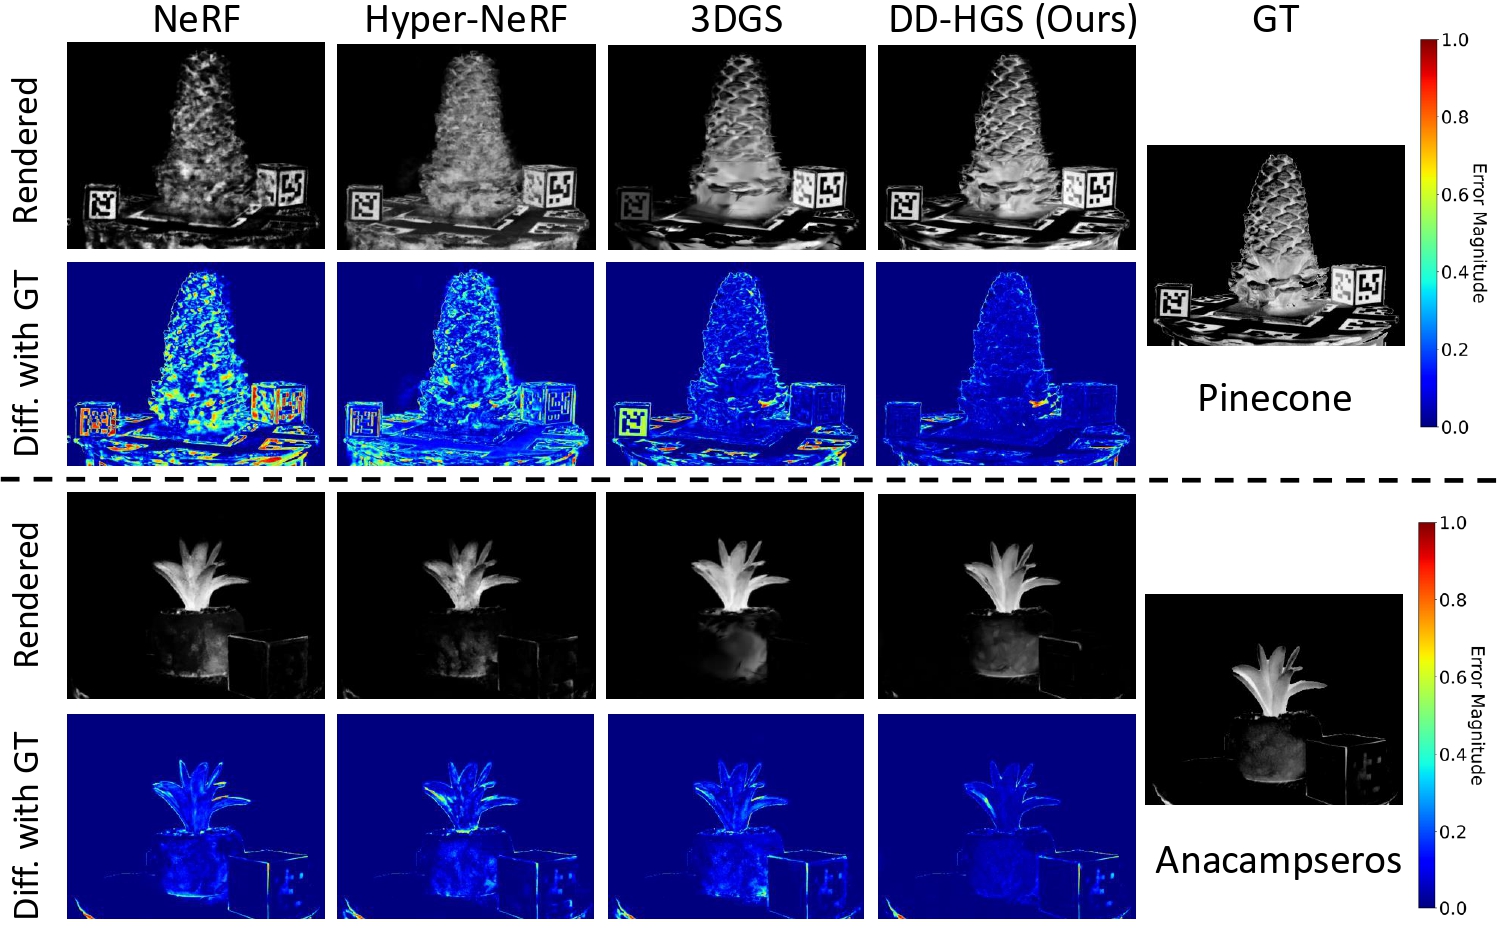
Qualitative results on the BaySpec dataset comparing our DD-HGS method with baseline approaches.
Surface Optics Dataset
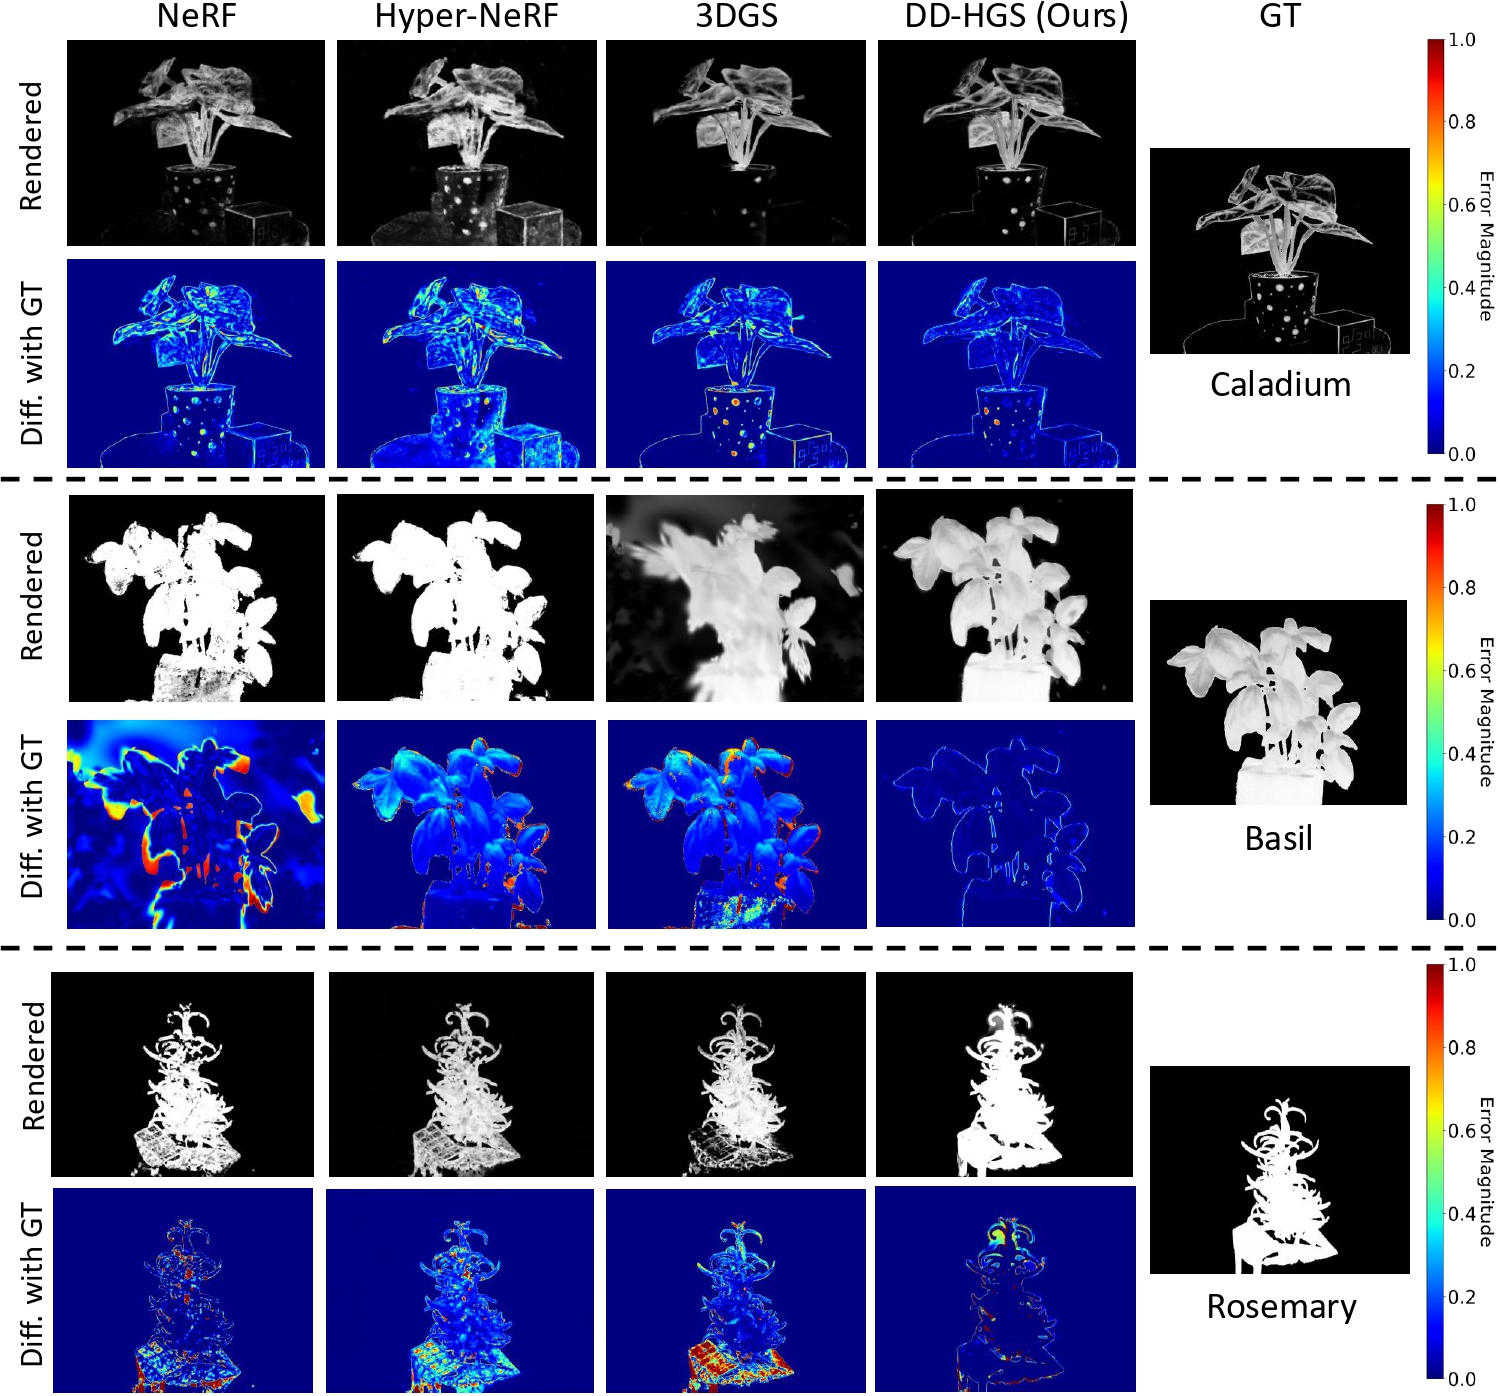
Qualitative results on the Surface Optics dataset comparing our DD-HGS method with baseline approaches.
BibTeX
@misc{narayanan2025hyperspectralgaussiansplatting,
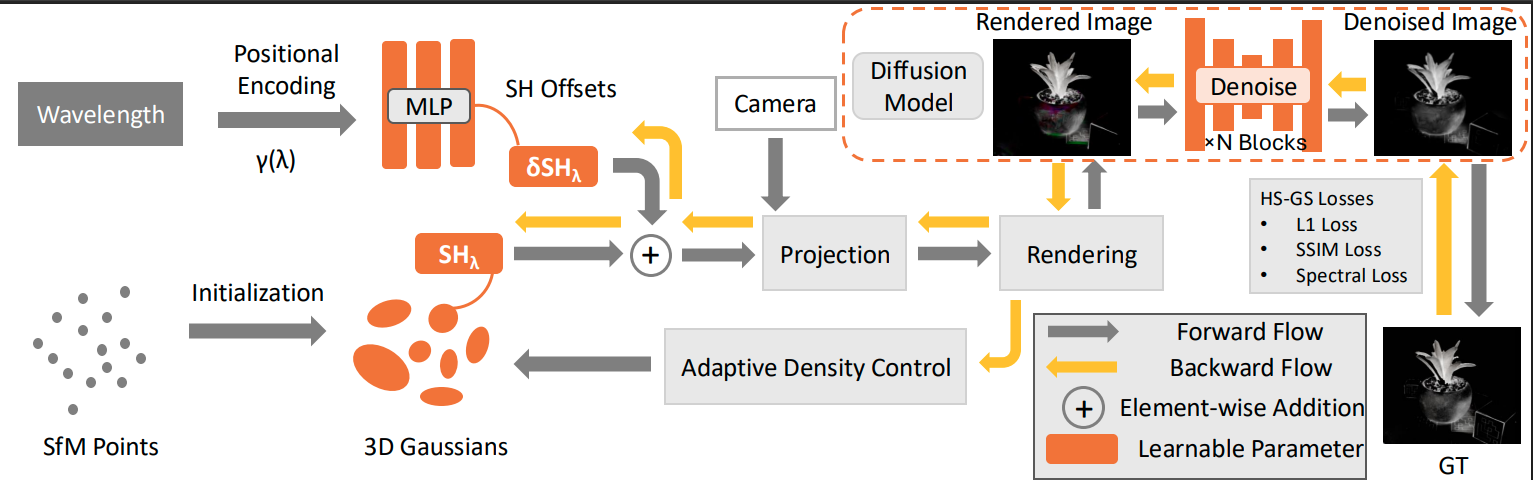
title={Hyperspectral Gaussian Splatting},
author={Sunil Kumar Narayanan and Lingjun Zhao and Lu Gan and Yongsheng Chen},
year={2025},
eprint={2505.21890},
archivePrefix={arXiv},
primaryClass={cs.CV},
url={https://arxiv.org/abs/2505.21890},
}